| . |

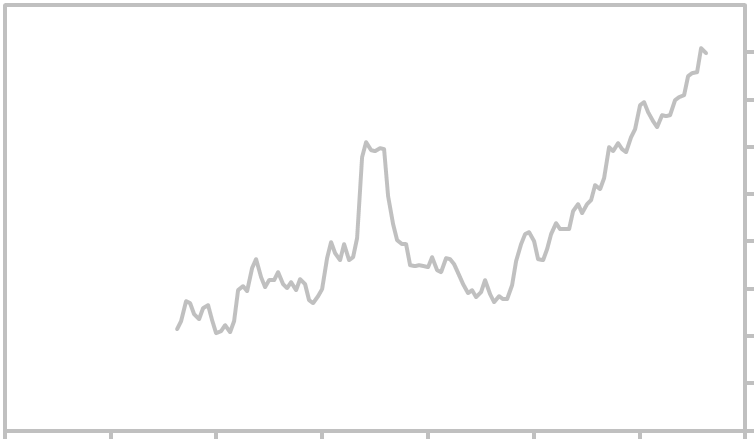
| South African Rand (ZAR) Currency Exchange Rate - 10 Year Chart |
| ZAR to USD Currency Rate Chart |
South African Rands per 1 US Dollar are shown in gray (ZAR per USD): Average daily rate per
calendar month. Updated Wednesday May 2,, 2018. If the line in the chart is falling (left to right), the
US Dollar has weakened, causing...
calendar month. Updated Wednesday May 2,, 2018. If the line in the chart is falling (left to right), the
US Dollar has weakened, causing...
| 10 Year Chart - South African Rand (ZAR) 20 Year Graph - South African Rand (ZAR) 20 Year Graph - Trade Weighted Currency Index |

20
22
6
10
12
14
8
16
18
| ______________________________________________________________________________ Search Report a Problem with this Page Site Map Contact us Privacy Policy Terms of Use/Disclosure SignalTrend Inc. 2008 - 2015, All Rights Reserved |
1/06
| 1/2008 |
| 1/2010 |
| 1/2012 |
| 1/20 |
| 1/2014 |
| 1/2016 |
| 1/2018 |