| . |


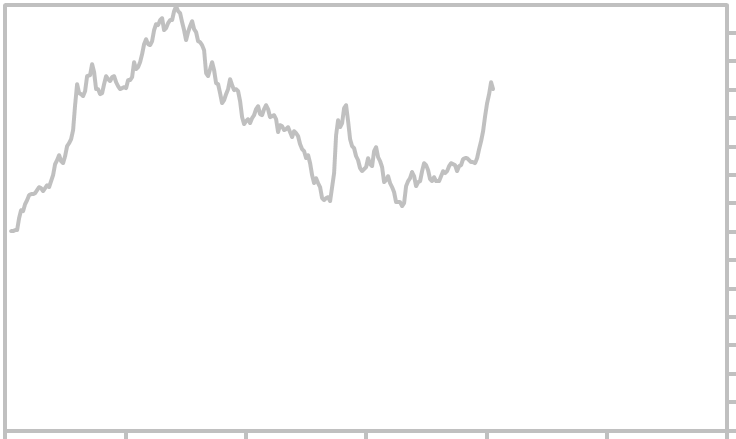
| Trade Weighted Exchange Index (Broad) - 20 Year Graph |
| Trade Weighted Exchange Rate Graph |
Trade Weighted Exchange Index for the US Dollar is shown in gray. It is a weighted average of the
foreign exchange value of the U.S. Dollar against the currencies of a broad group of major U.S.
Trading Partners: Average daily rate per calendar month. Updated Wednesday May 2,, 2018. If the
line in the chart is falling (left to right), the US Dollar has weakened, causing...
foreign exchange value of the U.S. Dollar against the currencies of a broad group of major U.S.
Trading Partners: Average daily rate per calendar month. Updated Wednesday May 2,, 2018. If the
line in the chart is falling (left to right), the US Dollar has weakened, causing...
| 90 |
| 95 |
| 100 |
| 85 |
| 80 |
| 105 |
| 110 |
| 115 |
| 120 |
| 125 |
| 55 |
| 60 |
| 65 |
| 70 |
| 75 |
| 10 Year Chart - Trade Weighted Exchange Index 20 Year Graph - Trade Weighted Exchange Index |
1/95
| 1/2000 |
1/2005
| 1/2010 |
| 1/2015 |
| 1/2020 |
| 1/25 |
| ______________________________________________________________________________ Search Report a Problem with this Page Site Map Contact us Privacy Policy Terms of Use/Disclosure SignalTrend Inc. 2008 - 2015, All Rights Reserved |