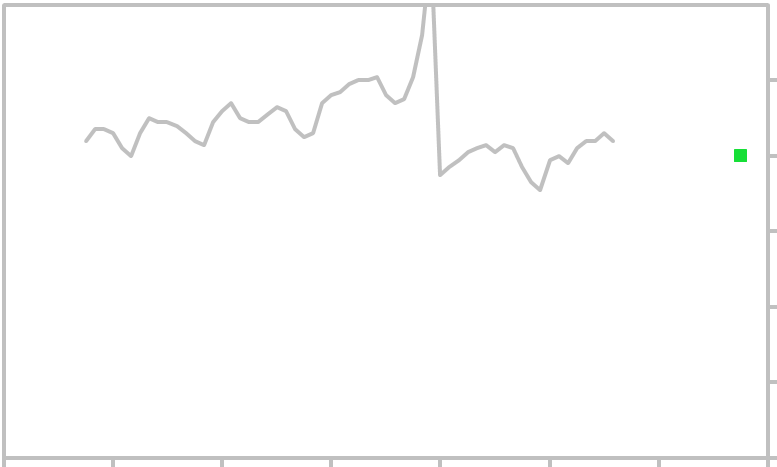
Monthly US National Personal Saving Rate is plotted in gray. The forecast for the target month is
shown in green. Other links related to this economic indicator are below.
US National Personal Saving Rate - 5 Year History
|
US Personal Savings Rate Forecast
Historical Personal Savings Rate
|
|
|
|
|
|
|
|
|
|
1959
1960
1961
1962
1963
1964
1965
1966
1967
1968
1969
1970
1971
1972
1973
1974
|
7.6
7.3
8.4
8.4
7.8
8.8
8.6
8.3
9.5
8.5
7.8
9.4
10.1
8.9
10.5
10.6
|
|
|
|
|
1975
1976
1977
1978
1979
1980
1981
1982
1983
1984
1985
1986
1987
1988
1989
1990
|
10.6
9.4
8.7
8.9
8.9
10.0
10.8
11.2
9.0
10.8
9.0
8.2
7.0
7.3
7.2
7.0
|
|
|
|
|
|
1991
1992
1993
1994
1995
1996
1997
1998
1999
2000
2001
2002
2003
2004
2005
2006
|
7.3
7.7
5.8
4.8
4.7
4.0
3.7
4.3
2.4
2.4
1.8
2.4
2.1
2.1
0.4
0.7
|
|
|
|
|
|
2007
2008
2009
2010
2011
2012
2013
2014
2015
2016
2017
|
0.6
1.8
4.3
5.8
4.4
3.6
4.9
4.8
5.4
4.9
3.5
|
|
|
|
|
|
Average US Personal Savings Rate is shown in this table: 1959 to present
|
|
|
|
|
|
Source: U.S. Bureau of Economic Analysis, Personal Saving Rate [PSAVERT],
retrieved from FRED, Federal Reserve Bank of St. Louis;
https://fred.stlouisfed.org/series/PSAVERT
1/14
1/2016
1/2020
US Personal Savings Rate Forecast
|
|
| |
|
Target Month:
Forecast:
HDTFA:
|
|
|
| |
Forecast for US National Personal Saving Rate for the target month
indicated. Measurement is in Percent (seasonally adjusted annual rate).
|
|
|