| . |

| Spot Oil Price: West Texas Intermediate - 100 Year Graph |
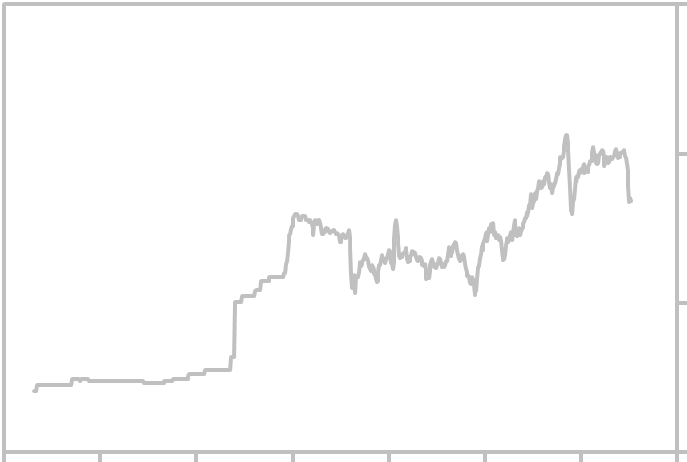
| 100 Year Oil Price History Graph |
The above graph shows monthly Spot Oil Price History: West Texas Intermediate in
logarithmic scale. Measurement is in Dollars per Barrel. Prior to 1946 U.S. Crude Oil
First Purchase Price from EIN is shown. Oil has traded in a long term channel for
over 110 years. For the forecast and other links related to this economic indicator, click the
links below. Updated Thursday, May 31, 2018.
10
1000
1
100
| 10 Year Chart - Historical Oil Prices 100 Year Graph - Oil Price History |
| ||||||||||||||||||||||||||||||||||||||||||||||||||||||||||||||||||||||||
| ______________________________________________________________________________ Search Report a Problem with this Page Site Map Contact us Privacy Policy Terms of Use/Disclosure SignalTrend Inc. 2008 - 2015, All Rights Reserved |
1910
| 1920 |
1900
| 1930 |
| 1940 |
| 1950 |
| 1960 |
| 1970 |
| 1980 |
| 1990 |
| 2000 |
| 2010 |
| 2020 |
| 2030 |
Source of Data after 1945: U.S. Energy Information Administration, Crude Oil Prices: West
Texas Intermediate (WTI) - Cushing, Oklahoma [MCOILWTICO], retrieved from FRED, Federal
Reserve Bank of St. Louis; https://fred.stlouisfed.org/series/MCOILWTICO
Source of Data Prior to 1946:US Energy Information.(U.S. Crude Oil First Purchase Price
(Dollars per Barrel)
Texas Intermediate (WTI) - Cushing, Oklahoma [MCOILWTICO], retrieved from FRED, Federal
Reserve Bank of St. Louis; https://fred.stlouisfed.org/series/MCOILWTICO
Source of Data Prior to 1946:US Energy Information.(U.S. Crude Oil First Purchase Price
(Dollars per Barrel)
0