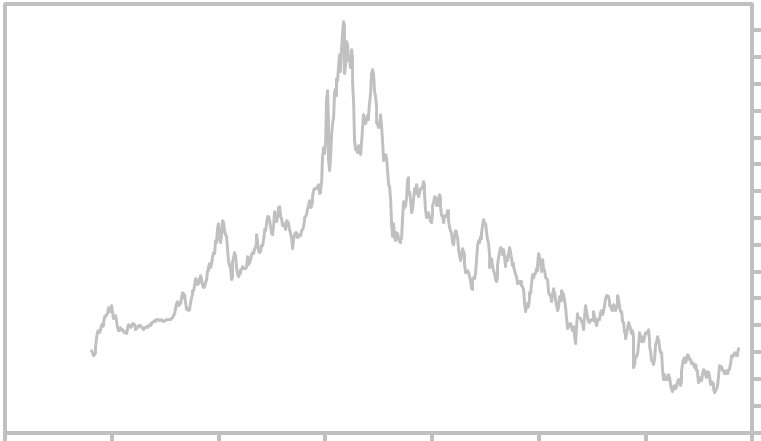
1954
1955
1956
1957
1958
1959
1960
1961
1962
1963
1964
1965
1966
1967
1968
1969
1970
1971
1972
1973
1974
1975
1976
1977
1978
1979
1980
|
2.51
2.97
3.59
3.97
3.86
4.69
4.72
4.06
4.08
4.13
4.23
4.62
5.22
5.75
6.03
7.65
7.91
6.73
6.55
7.40
8.04
8.43
7.90
7.69
9.01
10.65
12.84
|
2.29
2.61
2.84
3.21
2.88
3.96
3.80
3.71
3.84
3.83
4.15
4.19
4.61
4.54
5.42
6.04
6.39
5.70
5.95
6.46
6.96
7.39
6.87
7.21
7.96
8.91
9.78
|
|
|
|
|
1981
1982
1983
1984
1985
1986
1987
1988
1989
1990
1991
1992
1993
1994
1995
1996
1997
1998
1999
2000
2001
2002
2003
2004
2005
2006
2007
|
15.32
14.59
11.85
13.56
11.86
9.19
9.52
9.26
9.36
8.89
8.28
7.54
6.60
7.96
7.78
6.91
6.89
5.65
6.28
6.66
5.39
5.28
4.45
4.73
4.54
5.11
5.10
|
12.57
10.54
10.38
11.50
9.26
7.11
7.08
8.21
7.84
8.08
7.09
6.42
5.33
5.75
5.71
5.65
5.81
4.53
4.72
5.24
4.57
3.87
3.33
3.83
4.00
4.42
4.10
|
|
|
|
|
2008
2009
2010
2011
2012
2013
2014
2015
2016
2017
|
4.10
3.72
3.85
3.58
2.17
2.90
2.86
2.36
2.49
2.48
|
2.42
2.52
2.54
1.98
1.53
1.76
2.21
1.88
1.50
2.19
|
|
|
|
|
|