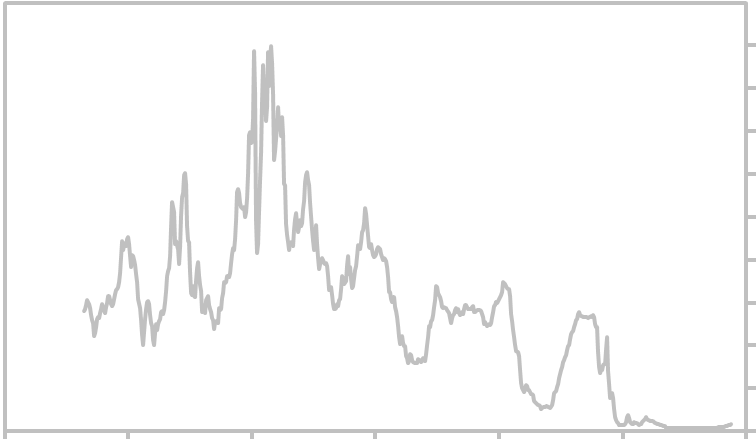
.
Bank CD Rates - 45 Year Graph
Bank CD Rates Graph
Average daily rate per month for the 6 month Bank CD is graphed above. Updated Tuesday,
December 18, 2018. Click the link below for the forecast.
12%
14%
16%
10%
8%
18%
6%
4%
2%
0%
10 Year CD Interest Rate Chart
45 Year Bank CD Rates Graph
Bank CD Rate Table
Year
High
Low
Year
High
Low
Year
High
Low
1965
1966
1967
1968
1969
1970
1971
1972
1973
1974
1975
1976
1977
1978
1979
1980
1981
1982
1983
1984
1985
4.88
6.14
5.95
6.39
8.95
9.06
6.06
5.65
10.71
12.06
7.89
6.31
6.96
11.28
13.97
17.74
17.98
15.12
10.17
12.08
9.60
4.23
5.07
4.45
5.53
6.58
5.73
4.04
4.02
6.03
7.78
6.25
4.76
5.05
7.18
9.98
8.33
12.65
8.80
8.46
8.85
7.58
1986
1987
1988
1989
1990
1991
1992
1993
1994
1995
1996
1997
1998
1999
2000
2001
2002
2003
2004
2005
2006
7.83
8.19
9.28
10.40
8.57
7.17
4.42
3.39
6.78
6.71
5.75
5.90
5.67
6.07
6.94
5.45
2.16
1.30
2.66
4.62
5.54
5.70
5.85
6.69
8.12
7.64
4.41
3.17
3.16
3.29
5.49
5.03
5.47
4.99
4.90
6.15
1.90
1.36
1.02
1.09
2.85
4.69
2007
2008
2009
2010
2011
2012
2013
2014
2015
2016
2017
5.40
4.37
1.76
0.75
0.67
0.58
0.29
0.13
0.14
0.15
0.19
4.85
2.18
.030
0.29
0.30
0.32
0.13
0.13
0.13
0.14
0.15
This table shows the yearly high and low annual percentage rate for the Bank
CDs from 1965 to present. The average daily rate for the month with the
highest average daily rate during each year is shown in the High column. The
average daily rate for the month with the lowest average daily rate during
each year is shown in the Low column.
______________________________________________________________________________
Search      Report a Problem with this Page     Site Map     Contact us

Privacy Policy     Terms of Use/Disclosure     SignalTrend Inc.  2008 - 2015, All Rights Reserved
1/60
1/1970
1/1980
1/1990
1/2000
1/2010
1/20