| . |

Commentary 28039 b
April, 2018 Data:
The annual US unemployment rate in April, 2018 was 3.70%. That's 0.40%
percent lower than the March, 2018 unemployment rate of 4.10%. It is 0.40%
percent lower than the April, 2017 unemployment rate of 4.10%. The fall in
unemployment rates from March to April indicates that the short term
unemployment rate trend has been down. If that trend continues, we should see
an unemployment rate in May, 2018 that is close to 3.30%.
The National Unemployment Rate one year ago was 4.10%. The average rate
over the last year was 4.18%. The average rate over the last 10 years was
6.96%. Lower rates over the last 12 months compared to the average rates
over the last 10 years serve as an indicator that the long term trend in the US
unemployment rate is down. Unemployment rate expectations should be
adjusted accordingly.
Forecast-Chart.com's historical research covers US unemployment rate data
back to January, 1948. The average annual unemployment rate during that
period of history was 5.78%. The highest rate was 10.80%. The lowest rate was
2.50%. The high was attained in November of 1982. The low was achieved in
May of 1953. Recent rates experienced in April of 2018 are low relative to the
historical 5.78% average.
This page provides a five year chart for US unemployment rates. For links to
more information on US unemployment rates, look at the links under the five
year chart (above). One link opens a ten year chart. Another opens a sixty year
graph of the National Unemployment Rate.
Data Source: U.S. Bureau of Labor Statistics
SignalTrend Inc. 2008 - 2018; All rights reserved.
_____________________________________________________________
Report a Problem with this Page Contact Us Privacy Policy Terms of Use/Disclosure
| US National Unemployment rate - 60 Year Graph |
| USA Unemployment Rate Graph |
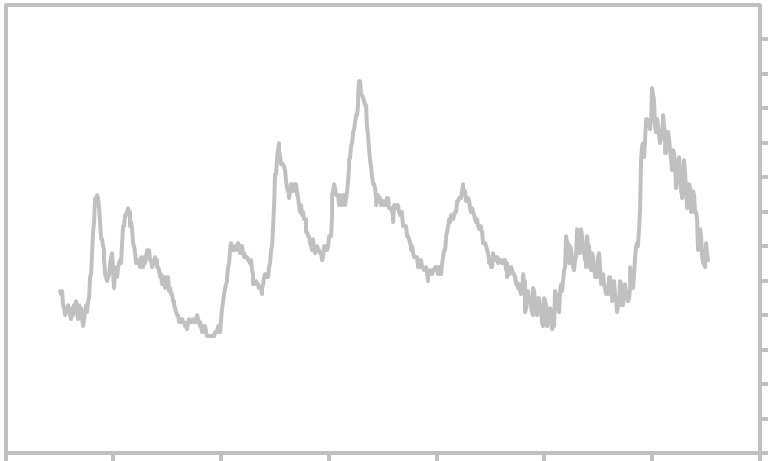
The above graph shows monthly USA National Unemployment rate. Measurement is in Percent (not
seasonally adjusted). For the forecast and other links related to this economic indicator, click the
links below. Updated Thursday, March 29, 2018.
seasonally adjusted). For the forecast and other links related to this economic indicator, click the
links below. Updated Thursday, March 29, 2018.

| 6% |
| 7% |
| 8% |
| 5% |
| 4% |
| 9% |
| 3% |
| 2% |
| 1% |
| 0% |
| 10% |
| 11% |
| 12% |
| 10 Year Chart - National Unemployment Rate 60 Year Graph - USA Unemployment Rate |
Current Unemployment Rate News:
1/50
| 1/1960 |
1/1970
| 1/1980 |
| 1/2000 |
| 1/20 |
| 1/2010 |
| 1/1990 |