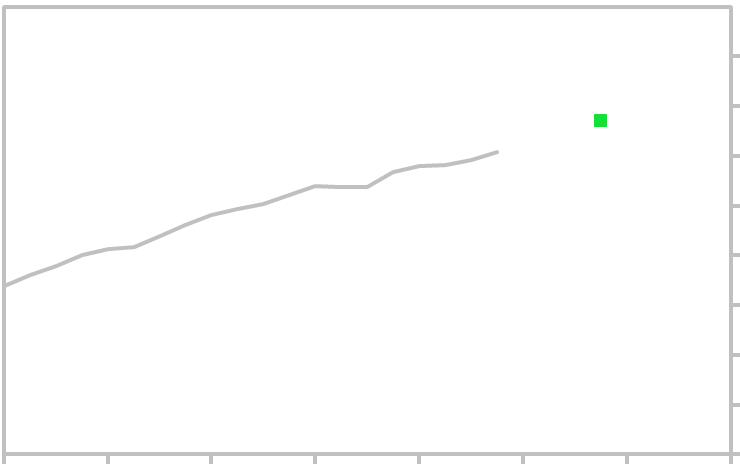
Quarterly US Federal Government Public Debt is plotted in gray. The forecast for the target quarter is
shown in green. Other links related to this economic indicator are below.
US Federal Government Public Debt - 5 Year History
|
6
10
12
14
16
US National Government Public Debt Forecast
18
20
22
|
|
|
|
|
|
|
1966
1967
1968
1969
1970
1971
1972
1973
1974
1975
1976
1977
1978
1979
|
0.3
0.3
0.4
0.4
0.4
0.4
0.4
0.5
0.5
0.6
0.7
0.7
0.8
0.8
|
|
|
|
|
1980
1981
1982
1983
1984
1985
1986
1987
1988
1989
1990
1991
1992
1993
|
0.9
1.0
1.2
1.4
1.7
1.9
2.2
2.4
2.7
3.0
3.4
3.8
4.2
4.5
|
|
|
|
|
|
1994
1995
1996
1997
1998
1999
2000
2001
2002
2003
2004
2005
2006
2007
|
4.8
5.0
5.3
5.5
5.6
5.8
5.7
5.9
6.4
7.0
7.6
8.2
8.7
9.2
|
|
|
|
|
|
2008
2009
2010
2011
2012
2013
2014
2015
2016
2017
2018
|
10.7
12.3
14.0
15.2
16.4
17.4
18.1
18.9
20.0
20.5
21.52
|
|
|
|
|
|
U.S. National Debt at year-end is shown in this table: 1966 to present
|
|
|
|
|
|
US Federal Government Public Debt is plotted in gray as a percent of GDP (Gross Domestic
Product).
US National Debt as a Percent of GDP
|
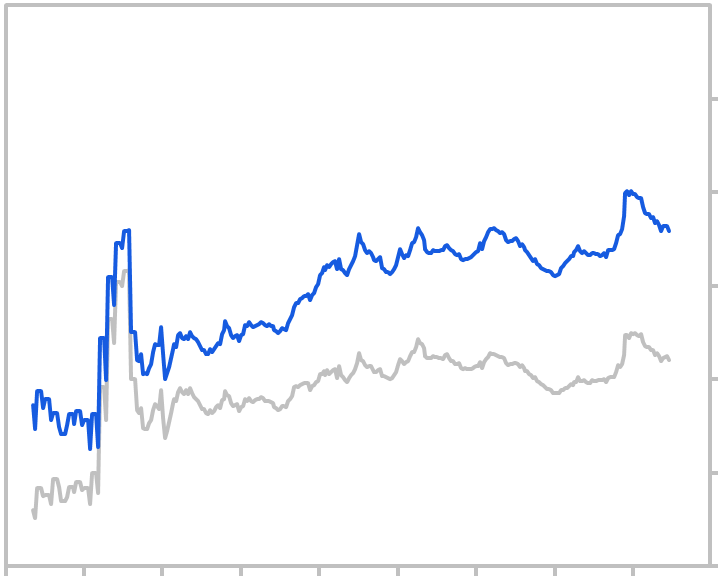
Quarterly US Federal Government Current Expenditures is plotted in gray as a percent of GDP
(Gross Domestic Product). Quarterly US Federal, State and Local Government Current
Expenditures is plotted in blue as a percent of GDP (Gross Domestic Product).
Government Spending as a Percent of GDP
|
1930 1940 1950 1960 1970 1980 1990 2000 2010 2020
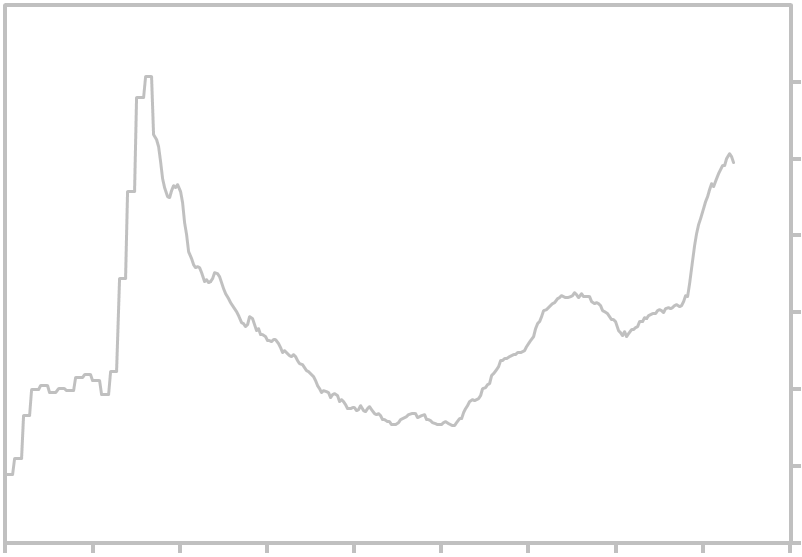
Annual US Federal Deficit or Surplus is plotted in gray as a percent of GDP (Gross Domestic
Product). A surplus is plotted as a positive percent. A deficit is plotted as a negative percent. The
U. S. Government's fiscal year ends in September. This chart is updated annually, after the data
becomes available (after September 30th of each year).
Federal Deficit as a Percent of GDP
|
1900 1920 1940 1960 1980 2000 2020
1930 1940 1950 1960 1970 1980 1990 2000 2010 2020
8
Source: U.S. Department of the Treasury. Fiscal Service, Federal Debt: Total Public
Debt [GFDEBTN], retrieved from FRED, Federal Reserve Bank of St. Louis;
https://fred.stlouisfed.org/series/GFDEBTN
US National Government Public Debt Forecast
|
|
| |
|
Target Month:
Forecast:
HDTFA:
|
|
2nd Quarter, 2020
$22.0
$0.73
|
|
| |
Forecast for US Federal Government National Debt for the target quarter
indicated. Measurement is in Trillions of Dollars (not seasonally adjusted).
|
|
|
1/15
1/2018